


Chapter 7
What we found: Body weight and body comp
What you’ll learn in this chapter
In this chapter, we’ll look at:
- How body size, weight, and composition (i.e., our ratio of lean mass to fat mass) are complex phenomena that are in part, shaped by genetic mechanisms… but not as much as we might assume;
- The role of genes involved in energy balance and regulation, and evolution’s legacy of protecting us from scarcity; and
- The role of other environmental factors, such as food availability, food reward, eating behaviors, and so on.
Two important points to keep in mind:
- While science is cool, and we have some interesting genetic findings and areas for further exploration, we still know comparatively very little.
- Just because a genetic test can tell you what body weight or composition you might have, it doesn’t mean that it can tell you the “perfect” diet, supplement, or exercise plan for you.
As you read this chapter, remember our usual caution:
As with most preferences, health risks, and genetic traits, there are many complex, intersecting factors.
There is almost never one single gene that inevitably leads to a given result.
Any genetic data we share are simply clues for further exploration.
The complexity of body weight and body fat
When it comes to weight and body fat, many people will say things like:
- I must have a slow metabolism.
- I think I’m genetically programmed to be fat / skinny / muscular / whatever.
- That person is in good shape because they have good genetics.
But is it really that simple?
(Spoiler alert: Ha ha! It’s biology! You already know by now that it ain’t.)
The key points in this chapter are:
- Body weight, body composition (i.e., our ratio of lean to fat mass) and body fat levels are influenced by our genes.
- But they are also affected by our environment and lifestyle choices.
Energy balance, nutrient processing, and eating behavior
Why do you eat? (Or not eat?)
Why are you the body size that you are?
The answer is complex.
It’s not just about “willpower” or your workout program.
There are many processes that affect body weight and composition:
- Energy balance: The balance between food energy consumed, and energy being expended to support our metabolism and activity. If more energy comes in than goes out, we will gain mass. If less energy comes in than goes out, we will lose mass. Thus, our energy balance determines body mass.
- Energy sensing: Our bodies’ ability to know how much energy we have available (for instance, in the form of stored fat).
- Nutrient partitioning: Will the nutrients you eat be stored (e.g., as fat or muscle glycogen) used (e.g., to build muscles, to repair damaged tissues, to fuel cellular activities), or burned off as heat?
- Appetite and food reward: Do we want to eat? Does eating seem fun and interesting?
- Eating behavior: What foods do we choose? How do we know when to stop eating?
Of course, all of these are influenced by the interactions between our genes and our environment.
As you can imagine, there are many genes involved in regulating metabolism, body weight or fatness, and eating habits.
Here are just a handful. As you read about what each one does, try to imagine how mutations in these genes might have a physiological consequence:
- There are 21 APO family genes that code for apolipoproteins, a large family of molecules involved in lipid transport and processing. We looked at the role of some APO proteins in the previous chapter.
- TCF7L2, which codes for transcription factor 7 and is linked to balancing blood sugar; variants of this gene are associated with a higher risk of Type 2 diabetes.
- PPARG, which codes for one of the peroxisome proliferator-activated receptor (PPAR) subfamily of nuclear receptors (you’ll remember we learned about nuclear receptors in Chapter 6 with the vitamin D receptor). PPARs are involved in regulating the expression of metabolic genes. Depending on the tissue and PPAR, they can promote fatty acid storage or breakdown, glucose metabolism, antioxidant responses, and so on. Because of this, they are likely involved in metabolic diseases such as cardiovascular disease or diabetes.
- LEPR, which codes for the leptin receptor. Leptin is a hormone involved in sensing how much energy we have available, whether stored in the form of body fat, or how much we’ve recently eaten.
- MC4R, which codes for the melanocortin receptor. The encoded protein interacts with adrenal and pituitary hormones. Defects in this gene can cause autosomal dominant obesity, meaning that you only need one copy of a gene variant to see effects.
- FTO, which codes for fat mass and obesity-associated protein, is related to glucose and energy metabolism, as well as the regulation of body fatness and size. FTO is also an RNA editor and is involved in regulation of muscle. We’ll look at FTO more below.
- LRP5, which codes for bone mass. LRP5 gene mutations are associated with lower bone density and a higher risk of osteoporotic fractures.
There are also genes involved in regulating eating behavior and energy balance (the balance between energy in from food, and energy out from metabolism and activity).
These include:
- UCP codes for mitochondrial uncoupling proteins (UCPs), which separate oxidative phosphorylation from ATP synthesis and dissipate energy as heat. People who “naturally” maintain a lower body weight may be more likely to convert excess energy from food to heat, rather than storing it as body fat.
- Related to this process is the gene ADRB3, which codes for a protein in the beta adrenergic receptor family. Beta adrenergic receptors are found mostly in fat tissue, and help regulate lipolysis (fat breakdown) and thermogenesis (heat production).
- AGRP codes for agouti-related peptide (or agouti-related protein). Along with other substances such as neuropeptide Y, this protein works in the hypothalamus, aka the body’s metabolic Mission Control, to regulate appetite and eating behavior.
- GHRL codes for two proteins: ghrelin and obestatin. Ghrelin goes up when we are hungry, stimulating hunger. The function of obestatin isn’t completely clear yet, but it may oppose the action of ghrelin.
Measuring body size and composition
Body mass
Many studies that explore the relationship between genes and body size or fatness use body mass index, or BMI.
BMI is simply a measure of the relationship between someone’s height and weight. The higher BMI is, the heavier someone is for their height.
The World Health Organization divides BMI into the following categories.
| BMI | Category |
| Below 18.5 | Underweight |
| 18.5–24.9 | Normal weight |
| 25.0–29.9 | Overweight |
| 30.0–34.9 | Obesity class I |
| 35.0–39.9 | Obesity class II |
| Above 40 | Obesity class III |
To put this in real terms, let’s say we have a person who is 5’6” (1.68 m) tall.
How might various BMIs look for them?
| BMI | Category | Sample weight |
| Below 18.5 | Underweight | Less than 114 lb (~52 kg) |
| 18.5–24.9 | Normal weight | 115 to 154 lb (~52-70 kg) |
| 25.0–29.9 | Overweight | 155 to 185 lb (~70-84 kg) |
| 30.0–34.9 | Obesity class I | 186 to 216 lb (~84 kg-98 kg) |
| 35.0–39.9 | Obesity class II | 217 to 247 lb (~98 kg-112 kg) |
| Above 40 | Obesity class III | Over 247 lb (~112 kg) |
What can BMI tell us?
In general, we know that at the population level (in other words, in a big group of people), if you have a higher BMI (past a certain point), you are more likely to:
- develop chronic diseases such as cardiovascular diseases, Type 2 diabetes, and cancer;
- have more body fat; and/or
- have certain kinds of metabolic problems.
At the population level, BMI is a proxy for body fatness.
If we took a randomly-selected group of 100,000 people, people’s BMI would be closely related to their body fat levels. Having a much higher-than-average BMI would likely mean higher-than-average body fat.
At the individual level (i.e., you), BMI is often too broad to be helpful.
The relationship between BMI and body composition is just an average. It doesn’t necessarily tell us about you specifically.
BMI tells us only how much body mass someone has, not what that mass is made of.
So a fit and lean but heavy rugby or American football player may have the same BMI as a sedentary person with much more body fat and much less dense muscle and bone. Similarly, an extremely lean ultramarathoner with naturally lighter bones may be designated as “underweight” though they are still also very fit and strong.
In our PN sample, not surprisingly, many people were “overweight” or even “obese” despite being fit and athletic, perhaps even leaner than average.
So when we look at how BMI is correlated with genetic data, we want to be careful about how we draw conclusions from that correlation.
Body composition
Thus, along with height and weight, we also look at body composition: the relative proportion of fat and lean mass (which, again, includes muscle, bone, and connective tissues).
Some genetic studies use waist circumference (WC) as a measure of body composition. Fewer genetic studies have used more accurate methods (such as caliper skinfolds, BodPod or hydrostatic immersion) to look for precise relationships between genes and how much fat or lean mass a person has.
We’ll look at data from some genome-wide association studies (GWAS) that uses the extremely precise computed tomography (CT) method, below.
As with BMI, we need to carefully interpret studies that correlate body composition with genetic data.
How measurements of BMI and body composition are taken and used can affect our conclusions.
Variations in BMI
Though many risk factors (such as FTO gene variants, which we’ll look at below) seem to be common across most groups, various populations differ in their risk.
For instance, although people of East Asian and South Asian origin tend to be among the world’s lightest and smallest (both traits shaped by heredity), they have a higher risk of metabolic disease at a lower BMI than people of European ancestry.
This means that knowing BMI alone, or potential links between genes and BMI, may not fully predict health or disease for people from certain groups.
As with many biological factors, both heredity and environment matter.
Height is strongly shaped by genetics, but we’ve been getting taller and taller over the last several decades. We’re also getting heavier.
Population-wide genetic changes are typically slower than this, while environmental conditions can change much more quickly (for instance, imagine how moving from a poor, rural region to an affluent, industrialized urban region might change many factors in a person’s body).
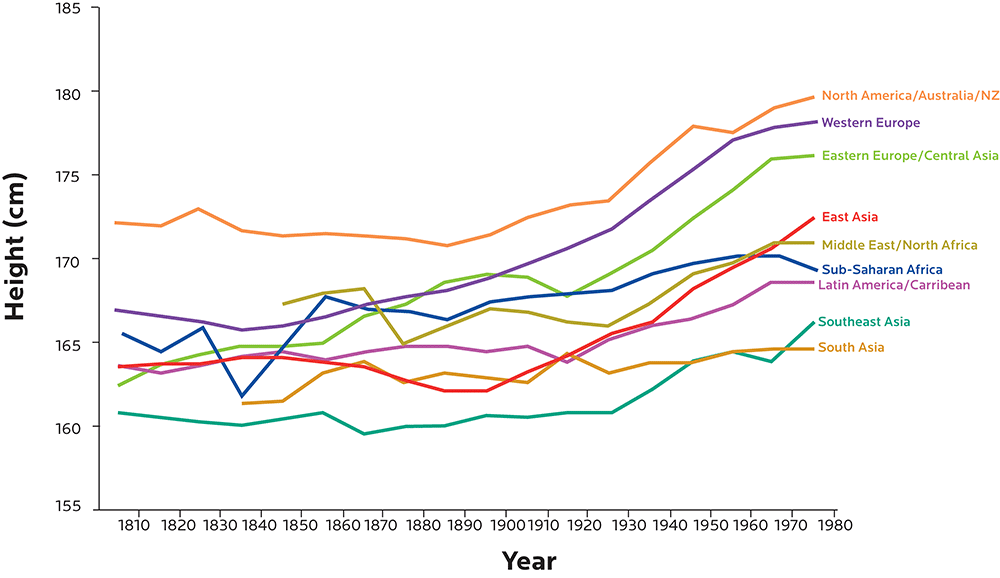
Figure adapted from Baten J, Blum M. Growing tall but unequal: new findings and new background evidence on anthropometric welfare in 156 countries, 1810–1989. Economic History of Developing Regions. 2012 Jun 1;27(sup1):S66-85., DOI: 10.1080/20780389.2012.657489.
In 1996, about 52% of Bangladeshi women were considered underweight (BMI lower than 18.5). Today, it’s only about 30%.
Conversely, in 1996, only about 3% of Bangladeshi women were considered overweight (BMI ≥ 25); that’s now quadrupled to about 12%.
Lightest countries in the world: Percentage of women with BMI lower than 18.5
| % with BMI <18.5 | Average height (cm) | Average height (ft/in) | |
| Eritrea | 37.30 | NA | NA |
| India | 35.60 | 151.9 cm | 5’0” |
| Bangladesh | 29.70 | 150.6 cm | 4’11” ½ |
| Vietnam | 28.30 | 152.2 cm | 5’0” |
| Ethiopia | 26.50 | 157.6 cm | 5’2” |
| Nepal | 24.40 | 150.8 cm | 4’11” ½ |
| Cambodia | 20.30 | 152.4 cm | 5’0” |
| Philippines | 14.20 | 151.7 cm | 4’11” ½ |
Data from WHO Global Database on Body Mass Index (BMI). Data for height / weight are most recent data available.
Although the United States, on average, has some of the world’s tallest and heaviest people, there are differences by ethnic group. (See table below.)
This is not 100% genetic, though.
(As we’ve seen, there’s significant variation within broader groups. For instance, labels like “Asian American” or “Latin American”, as are used in the US Census, are pretty loose categories that cover a wide range of groups and geographic origin.)
People from a given ethnic group not born in the US are more likely to have a lower BMI than their American-born genetic relatives.
(In other words, if you were born and raised in Somalia or Thailand, and your genetically similar sibling was born and raised in the US, they’d probably be heavier than you even if you later moved to the US to join them.)
Heaviest countries in the world: Percentage of women with BMI higher than 30
| % BMI >30 | Average height (cm) | Average height (ft/in) | |
| American Samoa | 80.2 | 166.6 cm | 5’5” ½ |
| USA | 34.3 | 162.9 cm | 5’4” |
| African American | 56.6 | 163.6 cm | 5’4” ½ |
| Latin American | 44.4 | 158.9 cm | 5’2” ½ |
| Asian American | 11.4 | 158.4 cm | 5’2” ½ |
| European American | 32.8 | 165.0 cm | 5’5” |
| Australia | 24 | 163.8 cm | 5’4” ½ |
| United Kingdom | 23 | 164.5 cm | 5’5” |
| Croatia | 22.7 | 166.49 cm | 5’5” ½ |
| Malta | 19.3 | 163.8 cm | 5’ 4” ½ |
| United Arab Emirates | 16 | 156.4 cm | 5’4” ½ |
| Greece | 13.5 | 166 cm | 5’5” ½ |
Data from Ogden CL, Carroll MD, Kit BK, Flegal KM. Prevalence of childhood and adult obesity in the United States, 2011-2012. JAMA. 2014;311(8):806-814. doi:10.1001/jama.2014.732.
BMIs here and elsewhere in the world are going up, often quickly.
This suggests that other factors besides genes are probably contributing.
How might environment play a role?
If, as we’ve seen, body size and mass depend on factors like energy balance or sensing, as well as eating and activity patterns, then changing environments can often disrupt our natural regulatory systems as well.
This can include, for instance:
- changes to physical environments — e.g., increasing industrialization of previously rural areas, or living out of sync with normal light-dark cycles in a 24/7 society.
- changes to social environments —e.g., changing social norms of eating and activity.
- changes in microbial environments —e.g., introducing new pathogens or having less diversity in our own personal microbiome.
- changes in physical activity —e.g., being able to commute long distances by car instead of walking.
- changes in food availability and production —e.g., a shift from working in the field growing staple crops to buying processed foods in supermarkets.
- changes in food palatability and reward —e.g., traditionally boiled hand-dug potatoes may become delicious, crave-able potato chips.
- changes in economic conditions and living standards —e.g., having an emerging middle class that does less physical labor and can buy more and better food.
- changes in crucial developmental conditions —e.g., childhood vaccinations that prevent diseases, or better maternal and infant nutrition, both of which can affect adult BMI.
- changes in chronic stressors —e.g., well… everything that we’re all freaking out about right now.
So even if we have “light / small genes” or “heavy / big genes” (were there such things), our environment would still strongly affect our BMI and body composition.
What this means for you
- Understand how genetic research measures body size, composition, and weight, and what that means (or doesn’t). Genetic testing may look for genes related to BMI, or amount of body fat, or both.
- Understand that populations are different than individuals. Your experience and body size, shape, or fitness is unique to you. Two people with the same body weight but different ancestry or environment will have a different probability of metabolic disease, and that metabolic disease may emerge through slightly different signaling pathways. Even if your genetic test results suggest, for example, you have a given risk of BMI-related metabolic disease based on a sample of 100,000 people… that risk may not apply to you.
- Understand that human variation is normal. There’s about 11” of height difference between the average woman in Bosnia-Herzegovina (5’7”) and the average woman in Bolivia (4’8”). There is a wide range of BMI that can be normal and healthy, and a wide range of people that can be healthy at a given BMI. So even if your BMI is genetically predicted to be higher or lower than average… you may be perfectly fine.
- Look at the interaction between genes and environment. We’ll mention this often through this chapter.
The genetics of body weight and fat
Evolution’s legacy
The medical and fitness communities have debated whether people who have “excess” body fat, or who have trouble managing their weight and/or their eating habits have a “disease” or “addiction”.
In fact, most of us who struggle to maintain a healthy body fat level or say “no” to that second donut are perfectly normal in genetic and evolutionary terms.
For example:
- Most humans evolved to store body fat. Humans who couldn’t do this well would risk starvation during times of scarcity. In particular, women need to have enough body fat to support the potential long-term energy demands of pregnancy and breastfeeding.
- Most humans evolved to prefer things that taste good, and to want to eat lots of food when it’s available. For most of our history, food was hard to get, and sweetness signaled things that were energy-dense and good to eat. This legacy affects our appetite, hunger, and fullness signals and regulation, especially in the 21st century when delicious, energy-rich foods are everywhere.
- Most humans evolved to conserve energy. In other words, we are naturally less inclined to move around if there’s no reason to do it. Why waste valuable energy when you don’t have to?
- Most humans evolved to seek rewards. What gets us off our butts and out of the safety of the burrow? The promise of something good. Our brains have complex circuits that inspire us to explore, be curious, and chase things that reward us (such as food, fun, and mates). Many types of energy-dense foods give us a chemical “hit”, helping us synthesize feel-good neurotransmitters.
So having some squish on your body, or loving ice cream, or preferring to lie on the couch rather than go to the gym, doesn’t mean your body is broken.
It probably means your genes are doing their job of finding and conserving precious energy.
Traits that were evolutionary advantages for most of our history — when food was scarce, daily energy demands were high, and rewards were hard to come by — are simply a mismatch now. Especially if we want to be lean or stay away from the chocolate-covered pretzels.
For genetic expression, environment matters.
Epigenetics and environments
In Chapter 2, we introduced you to the concept of epigenetics — the ways in which our genetic expression is regulated.
Let’s say we have two genetically identical people — in other words, identical twins.
One twin is leaner. The other is heavier and/or fatter.
Why the difference?
Good question.
One of the most useful ways to explore the contribution of genes and environment, particularly when it comes to body size and metabolism, is to look at twin studies.
Identical twins, of course, share the same genetic blueprint, and often the same early-life experiences. Yet they end up looking different as adults if they do different things, or live in different environments.
If we examine our two different-looking twins — perhaps one twin is leaner and lighter, while the other is significantly overweight or obese — what might we find?
Well, differences may have started in utero.
For instance, if one twin hogs all the nutrients while both twins are in the womb, this also affects genes such as IGF1R, which codes for insulin-like growth factor 1. IGF1 is an important protein involved in anabolism (growth) and development, and thus affects body size and mass.
Fun factoid!
The gene that codes for another insulin-like growth factor, IGF2, is only expressed from paternal inheritance — in other words, the genetic material you got from dad.
This epigenetic phenomenon is known as imprinting: the silencing of genetic material from one parent or another.
As adults, compared to their leaner twins:
- Obese twins tend to have more fat in the areas we’d expect: under the skin (subcutaneous fat), around the internal organs (visceral fat), marbled in muscle tissue (intramuscular fat) and laced into the liver and kidneys.
- Obese twins tend to be less sensitive to insulin (which is related to how much fat they have in their liver).
- Obese twins express some gene pathways more strongly, particularly genes involved in inflammation, as well as genes involved in organizing cell structures, cell growth, and transport between cells.
- Obese twins’ immune systems are more highly activated (aka upregulated), as if preparing to fight off pathogens. One study found that the most overexpressed gene in obese twins is SPP1, which codes for osteopontin, a cytokine (cell signaling molecule) that helps recruit immune cells such as macrophages and T cells during inflammatory processes.
- Obese twins have other gene pathways that are less expressed (i.e., downregulated), such as pathways involved in energy metabolism and/or breaking down fatty acids and amino acids.
- Obese twins have fewer copies of mitochondrial DNA in their fat tissue — sometimes nearly half as much as their leaner twins. This might partly explain the metabolic problems we see. Defects in mitochondrial energy metabolism in subcutaneous adipose tissue may encourage the body to store fat elsewhere, particularly in tissues that are especially sensitive to insulin (such as the liver, skeletal muscle, and pancreas), resulting in severe insulin resistance.
- Obese twins often prefer fatty or sugary foods more than their leaner siblings.
Given, again, that each pair of monozygotic (identical) twins are essentially genetic clones, these differences tell us:
Body size, fatness, and metabolic health are not just about the genetic code we are given.
Rather, epigenetic expression of these genes is also crucially important.
The good news, though, is that many of these up- or down-regulations can change if:
- body weight / fat changes;
- people change what they eat; and/or
- they change their physical activity.
We’ll look at this more in the final chapter on what to do.
The polygenic basis of obesity
Regulating all of these functions above (such as energy balance and storage, hunger and appetite, etc.) is pretty important for our survival.
To date, we know of about 185 genes that are implicated in obesity — or more accurately, in making it slightly more likely that a person may be heavier or fatter than average.
These genes may be expressed differently in adults and children, and/or in various populations, due to environmental factors or genetic variations.
More advanced GWAS using computed tomography (CT) let researchers look at various types of body fat and differentiate visceral fat (around the internal organs) from subcutaneous fat (under the skin).
Such studies have, to date, only confirmed links between fat and 8 SNPs near the following genes:
- ETV5, which codes for ERM proteins, an ancient protein family of transcription factors.
- FLJ35779, which codes for POC5, a protein involved in regulating cell mitosis and structure. POC5 is mostly expressed in the prostate. Other key sites include thymus, mammary gland, and bone marrow.
- FTO, which we’ll look at more below.
- GIPR, which codes for receptors involved with signaling for gastric inhibitory polypeptide (GIP), one of the incretin (insulin-stimulating) hormones released by the gastrointestinal tract that enable our bodies to process glucose. Variants in this gene may be related to developing Type 2 diabetes or having more visceral fat. Some research also suggests that high levels of GIP might be involved in adipose tissue inflammation, a characteristic of obesity.
- LINGO2, which codes for a protein called leucine-rich repeat and immunoglobulin domain (LINGO), involved in growth and regulation of axons in the nervous system (for instance, it’s linked to Parkinson’s disease). It’s also involved in cell signaling (aka signal transduction), the process by which cells send chemical messages to each other. (You’ll remember we learned about signaling pathways in Chapter 6.) It’s not clear exactly how this protein contributes, though.
- NEGR1, which codes for neuronal growth regulation factor 1 (NEGR1). This protein, strongly expressed in the hypothalamus (which, you’ll remember from Chapter 6, helps regulate body weight and appetite), seems to play a role in brain function and structural integrity. It’s also expressed in adipose tissue, particularly subcutaneous fat. This gene showed up in a study of patients with bulimia nervosa, and correlated with some of the cognitive dimensions of disordered eating, such as having poor interoception (i.e., being able to correctly read signals from inside one’s body).
- SH2B1, which codes for sarcoma homology 2 B adaptor protein 1 (SH2B1). This protein is part of a family of proteins involved in signaling for many hormones, peptides, and cytokines (cell signaling molecules), such as leptin, insulin, growth hormone (GH), IGF-I, nerve growth factor (NGF), and brain-derived neurotrophic factor (BDNF), which we’ll look at below. These regulate energy balance, body weight, insulin and glucose, anabolism, and other metabolic activities.
- TMEM18, which is an evolutionarily conserved gene (in other words, it’s been around a long time and appears in many species) that codes for a transmembrane protein (a protein that runs through a cell membrane, usually as a bridge between the inside and outside of the cell). We don’t completely know what this protein does. 23andMe tests for a SNP, rs6548238, that seems to predict small variations in body weight (between about 1-3 lb of difference). Each copy of a T rather than a C at rs6548238 near the TMEM18 gene was associated with 0.26 units lower BMI (equivalent to 1-3 pounds, depending on height).
Each of these genes can affect a different yet related physiological process: fat or glucose metabolism, cell signaling and gene regulation pathways, membrane transport, etc.
While there are certainly some rare genetic conditions that can make a few people more likely to be obese, it’s not as clear-cut as many people might think.
Outside of environmental effects, simply having a single genetic variant (or even a collection of variants) might only affect body weight by a pound or two (0.5 to 1 kg).
Even in extreme cases of apparently genetic obesity that don’t respond to nutrition and exercise, the most common mutations (in the melanocortin-4 receptor gene) only appear in 1-6% of people with obesity.
Allelic heterogeneity
Let’s say on a few separate occasions, you eat:
- suicide-spicy chicken wings
- an extra helping of pie with whipped cream
- an entire bag of gummy candy
- a hot dog with fried onions, cheese curds, and sauerkraut
Each time, you are wracked with heartburn afterwards.
The foods that caused that heartburn were different, but all might fall loosely under the heading of “foods you might eat at a carnival”.
Allelic heterogeneity works the same way: Related genetic variants, or alleles (different types of “junk food”), in the same general location (our carnival) are associated with the same trait or outcome (heartburn).
This means that if we look only at hot dogs, or only at pie-eating contests, we might miss the fact that a wide variety of foods might lead to the same result.
We might even come up with inaccurate theories like “Round-shaped foods are bad”, instead of looking at carnival food overall as a broader, more complex phenomenon.
Similarly, if we look only at one gene variant, we might not realize that many related gene variants can affect the same biological process. In the case of obesity, this is certainly true.
(And come to think of it, most carnival foods don’t do our metabolism any favors.)
Probabilities and risk score
Many studies on the relationship between body fatness / size and genetics look at several genetic variants, and create a “risk score”.
This score simply adds up all the known possibilities from each combination of variants, and decides how likely (or not) a certain outcome is.
Let’s say a study looks at 10 different genetic variants that are known to affect body fatness / size. And let’s say you have 4 of those variants. Now you have a “risk score” of 4, which may explain 0.1% of your body fatness.
Most research has found that even with elaborate “risk scores” (for instance, with a dozen or more genetic variants known to affect body fatness / size), specific genetic combinations may only explain 1 or 2% of the differences in body weight.
So even if you have, say, 15 or 20 of the known genetic variations that make you more likely to have more body fat than average, those variations may only explain 2% of the reasons why you’re bigger than your buddy.
For instance, a study done in people with Han Chinese ancestry explored 26 genetic variants that might affect BMI.
Of those, four variants (TMEM18, PCSK1, BDNF and MAP2K5) were statistically significant – for a BMI 0.13 higher per variant.
Thus, having all four statistically significant variants might give you a BMI that’s 0.52 higher than average, assuming all your other environmental conditions are the same as everyone else.
To put that in real terms:
Let’s say you’re from that population. You’re 5’6” (1.68 m) tall:
- Your “average” buddy might be 150 lb (68 kg), with a BMI of 24.2, in the healthy range.
- You with your four genetic variants might be 153 lb (69.4 kg), with a BMI of 24.7.
Hardly a shocking difference.
Another study that looked at approximately 12,500 people of European descent concluded that lifestyle factors, particularly exercise, explained about 6 times more of the BMI variation than genetic factors.
Overall, researchers estimate that only about 50-60% of BMI is inherited.
This means that even if you have quite a lot of genetic variations that make you more likely to be heavier or fatter, those variations only play small roles.
What you eat, how you exercise, your daily routines, your stress level — all of these are far more important in shaping how your genetics are expressed.
Obviously, we can’t look at all the genes that might affect your personal body size and shape.
But let’s look at one that may play a major role: FTO.
FTO
The FTO gene codes for a protein known as fat mass and obesity-associated protein. It regulates the expression of genes involved in metabolism by demethylating nucleic acids.
Methylation is an important process in epigenetics that involves attaching a methyl group (a carbon and 3 hydrogens, aka CH3), to a strand of DNA or RNA, often to the cytosine molecule.
When DNA or RNA is methylated, certain genes are often “switched off”, which can be a problem if you want those genes to be transcribed and protein made.
FTO can reverse this process with demethylation — removing the methyl group, and “switching on” certain genes by increasing gene transcription. We’ll look more at methylation in Chapter 8.
The FTO gene is an ancient one, found in many vertebrates. It may have appeared about 450 million years ago. It even appears in algae, though not other invertebrates, which suggests that perhaps a horizontal gene transfer occurred.
Originally, researchers discovered the FTO gene in mice with odd-looking feet, leading to the original gene name of Ft — fused toes.
FTO was one of the first genes to be identified in GWAS. Unlike many other genes linked to particular traits, its effects in many populations have been fairly well replicated.
FTO is expressed throughout the body (for instance, in fat, stomach, and skeletal muscle tissue) but most strongly in the brain, particularly in regions associated with energy balance and reward-seeking. This suggests that FTO may also be involved in particular behaviors, such as appetite regulation, self-control or impulsivity.
Along with FTO’s potential effects on things like growth or metabolism, this implies that FTO genetic variants can have widespread effects on both physiological processes and behaviors that affect body size and fatness. Indeed, FTO is upregulated during periods of food deprivation.
Many SNPs on the FTO gene have been explored, and potentially linked to differences in body fatness.
Importantly, these SNPs may not cause changes in body fat; they may simply predict it. Other factors may be involved.
These SNPs include:
- rs1121980, strongly linked to adult obesity (BMI > 40) with odds ratio of 1.55 in a population of French individuals of European ancestry.
- rs1421085, found to be significant in a smaller study of about 600 women of European ancestry who were currently obese (BMI > 40) and who had gained weight quickly and dramatically as teenagers. Interestingly, this study was also able to compare about 100 women with their sisters, who had much lower BMIs (≤25), and show that the heavier sisters were, indeed, genetically different in this SNP. The role of rs1421085 was also shown in a population of Hispanic Americans.
- rs17817449, which was found to have a strong predictive value in a small group of about 200 people in Western Spain who not only gained weight quickly as teenagers, but also had two or more close relatives with BMI higher than 40.
- rs8057044, found to be most predictive of higher body weight in a population of about 500 African American girls compared to their classmates of white European ancestry. rs3751812 was also found to be significant in a similar African American population, as well as Hispanic Americans.
- rs9939609, which we’ll look at more below.
FTO expression seems to be connected specifically to fat tissue, rather than other types of tissue that could affect body weight, such as muscle and bone.
Thus, having particular FTO variations probably means that if you have more body weight (i.e., a higher BMI), it’s from body fat rather than lean mass.
In populations with European and East Asian ancestry, there seems to be a larger cluster of FTO SNPs that may relate to BMI, whereas in populations of African ancestry, there seem to be fewer BMI-related SNPs across a smaller region.
That said, other more detailed studies in smaller populations (such as Old Order Amish or Japanese) have also found other SNPs that seem significant to that specific population — for instance, rs1861868 was found to be significant in Old Order Amish, but hadn’t been previously associated with obesity in other studies.
To date, about 90 genetic variants within FTO have been associated with BMI.
23andMe tests for 124 SNPs on FTO.
In particular, 23andMe highlights the SNP rs9939609. People with an AA genotype for this SNP tend to have a higher BMI, while people with TT tend to be lower. (ATs are typical odds.)
For some people of European ancestry, having the AA form of rs9939609 does seem to relate to being heavier. This seems to start younger, and persists into adulthood.
The 16% of European adults who were AA weighed about 6-7 lbs (about 3 kg) more than those who were AT or TT. Their chance of being obese was 1.67 times greater.
Other research in Europeans suggests that the AA form was linked to feeling less satisfied after meals. Some AAs also seemed to have “loss-of-control eating episodes”, especially with high-fat foods.
Researchers have found similar relationships between an AA variant of this SNP and being heavier in Japanese populations, Korean populations, Pakistani and North Indian populations, indigenous North American populations (such as Ojibway-Cree or Inuit) and Mexican-mestizo populations (i.e., people who have indigenous Central American ancestry).
Yet, this SNP did not always seem to have the same relationship for people of Han Chinese descent, nor did it appear as often in general in that population. Same goes for several Oceanic populations (Melanesians, Micronesians, and Polynesians) and a Gambian population in Africa.
In addition, the rs9939609 SNP seemed to “flip” its function depending on age — before about age 3, having the AA version was associated with lower body weight.
OK… it sounds like FTO plays some important role, right?
Well… we still don’t have the whole picture just yet.
Basically:
Some studies suggest that FTO can affect body size, fatness, and weight loss, but it’s not clear to what extent.
On top of this, lifestyle choices and environmental factors can strongly change the outcome.
For instance, if you’re more active, you’re often leaner.
As with other genetic variants that may predispose people to more body fat, physical activity often seems to override any potential FTO effect on body mass.
One systematic review found that no matter what type of rs9939609 FTO variant people had, they responded equally well to weight-loss interventions such as improving their diet, getting more exercise, or taking weight-loss drugs.
In other words:
Regardless of your genetic makeup, the way to get and stay relatively lean, fit, and healthy is the same for everyone.
Darn you biology!
Why must you be so complicated and fickle?!
Interestingly, this SNP was also linked to other traits, such as:
- Alcohol use — people of European descent with the AA variant tended to drink less.
- ADHD in preschool children
- Age-related cognitive decline, such as Alzheimer’s or memory loss. Particular FTO SNPs (such as rs9939609, rs8050136, rs3751812) may interact with the Alzheimer’s apolipoprotein E (APOE) ε4 risk allele, increasing the risk for dementia and Alzheimer’s nearly three times. You’ll remember we looked at Alzheimer’s in the previous chapter.
What we found in our sample
In our PN sample of 32 people, we found some interesting things.
We looked at 8 SNPs with a suggested relationship to BMI.
Note that each SNP combination has a slightly different possible outcome. For instance, some predict a higher, typical, and lower BMI. Others might predict only higher-than-typical and typical (rather than lower).
| Gene | SNP | Variants and trait associated with each | ||
| near MTCH2 | rs10838738 | GG – higher BMI | AG – typical BMI | AA – lower BMI |
| near MC4R | rs10871777 | GG – higher BMI | AG – slightly higher BMI | AA – typical BMI |
| near GNPDA2 | rs13130484 | TT – higher BMI | CT – typical BMI | CC – lower BMI |
| near SH2B1 | rs4788102 | AA – higher BMI | AG – typical BMI | GG – lower BMI |
| near TMEM18 | rs6548238 | CC – typical BMI | CT – lower BMI | TT – much lower BMI |
| near FAIM2 | rs7138803 | AA – higher BMI | AG – typical BMI | GG – lower BMI |
| near BDNF | rs925946 | TT – higher BMI | GT – typical BMI | GG – lower BMI |
| FTO | rs9939609 | AA – higher BMI | AT – typical BMI | TT – lower BMI |
First, there seemed to be no strong or consistent correlation between particular SNPs and BMI.
On average, the trend for the PN folks was to be heavier than predicted by a given SNP.
(This makes sense if we think about the PN population, which is likely to have more lean body mass than average.)
Second, many people had the “wrong” SNPs for the predicted outcome.
For instance, people whose SNP combos said they “should” be heavier were actually lighter. People who “should” be lighter were actually heavier — often significantly.
Along with objective measurement of BMI, we also asked people to self-report on whether they struggled with managing their weight or body fat.
Some people’s self-reports were objectively accurate.
For instance, if they said they’d always been lean / normal, their histories and BMI showed this. Or if they said they’d always struggled with their weight / fat, their histories and BMI showed this as well.
In particular, some people who were heavier also said they didn’t feel like they had a “shutoff switch” with eating. They often found it hard to stop when they’d had enough.
However, this trouble with satiety didn’t necessarily correlate to alleles associated with obesity. There are probably other factors at work (such as stress or habit).
Nor did liking sugar correlate to body weight. Some of the biggest sugar fiends in the group were normal weight, perhaps even on the low end of normal.
Other people’s self-reports were not objectively accurate.
In particular, many people reported struggling with their weight even if they had maintained a consistently normal or even low BMI or body fat level for most of their lives.
What does this tell us?
- BMI (and body fat percentage) can be objectively measured, and potentially connected to genetic variants, especially with a large population.
- However, some SNP associations may not be strong enough to show a consistent trend. They might not give us enough useful information to help us make decisions.
- People’s subjective experience of feeling heavier / fatter (or smaller / skinnier) may affect their perception of what their genetic makeup is, or should be. This perception may affect their behaviors. If we think we are “destined” to be a certain way, might we make choices that reflect that? Might we self-report as different than we really are, thus confounding the data?
- Once we get our test results, which results will we “believe”? For instance, you are technically “obese” but your genetic test tells you that you have “skinny genes”, how might you respond? Will this result inspire you, puzzle you, demotivate you, or somehow change your perspective about your body?
What this means for you
- Your genes are probably working just fine. Most humans have evolved to store body fat, enjoy eating tasty things, and avoid unnecessary activity. If you have more body fat than you (or current social norms) would prefer, like eating tasty things, and don’t always feel motivated to exercise, it doesn’t mean there is anything genetically “wrong” with you.
- Unless you have a measurable genetic condition, you are probably somewhere within the zone of “genetically average” for your age and ancestry. While genetic tests seem to help predict risk, the evidence doesn’t support this — yet.
- In most cases, energy balance, lifestyle choices, and environment affect our body weight and fatness much more than genetics. Though it may sometimes feel like it’s harder or easier to gain or lose weight, this may be more related to how your unique body is living in its environment, and less related to a “genetic blueprint”.
- Even if you carry a ton of genetic variants that may make it more likely that you’ll be heavier or have more body fat than average, these will likely only explain a small percentage of your body size and fat levels.
- If you want to change your body weight and/or body fat levels, look at your environment and behaviors. Nutrition and lifestyle habits (such as smoking or drinking), plus regular physical activity are the most important factors affecting body weight and body fat.
Again:
No matter what your genes are, the path to get and stay lean, healthy, and fit is more or less the same for everyone.
We’ll look specifically at what you can do in the last chapter of the book.
The polygenic base of underweight and anorexia
What about the opposite end of the spectrum of BMI — being lighter, smaller, or thinner than average?
Outside of childhood wasting diseases and clinical cases of anorexia nervosa, this domain of genetic research has gotten less attention.
As with a genetic propensity to be heavier and/or fatter, a genetic propensity to be lighter and/or thinner probably involves many factors such as natural body structure, energy balance regulation, and/or eating behaviors.
One group of researchers initially studying extreme cases of apparently genetic obesity discovered that the “opposite” of a particular genetic configuration — that is, duplication of a short region on chromosome 16, rather than a deletion — resulted in the “opposite” body weight as well. Duplication was often associated with being underweight, while deletion was associated with being obese.
As with the higher end of the BMI spectrum, being significantly thinner / smaller / lighter than average often means that energy balance is out of sync with normal physiological demands. Of course, this often happens when we are sick, injured, or under extreme stress.
But when circumstances are otherwise normal, very low BMI usually means that people are eating much less food than their body might need in order to function properly.
The terminology of “orexia”
The ancient Greek word orexis, or appetite, gives us many words.
Orexins are hormones that regulate appetite. (Interestingly, no clear link has been found between HCRT, the gene that codes for orexins, and weight.)
The term anorexia simply means “without appetite”.
Low appetite can happen for many reasons: illness, injury, stress, aging, medications, and so forth.
Anorexia nervosa is a form of disordered eating and persistent food restriction that’s usually accompanied by an unusually low body weight, an intense fear of gaining weight, and a distorted perception of body weight.
People may be choosing to eat less (thus overriding their natural desire to eat). Or they may be responding to strong signals from their appetite centers that tell them to stop eating, even though the body is not necessarily getting the energy or nutrients it requires. (This latter situation is common in older people for various physiological reasons, and is known as the anorexia of aging.)
Again, there are many factors involved in having a significantly lower body weight or less body fat than average, including several possible genetic contributors.
BDNF
One of the most-studied genes is variations on the BDNF gene, which can affect metabolism, eating behaviors, and activity.
BDNF codes for brain-derived neurotrophic factor (BDNF), which is part of a family known as neurotrophins.
The suffix “-troph” comes from the ancient Greek trophe, meaning “food” or “nourishment”, and generally refers to growth. Thus, neurotrophins are chemicals involved in the growth, development, differentiation, and survival of neurons, the cells of our nervous system.
BDNF is found throughout our nervous system, as well as in our blood and other tissues such as the retinas of our eyes, the kidneys, skeletal muscle, and the prostate.
Not surprisingly for something so widespread, BDNF has many jobs.
For instance:
- It regulates the development of neurons as well as neuronal plasticity (i.e., changing neural pathways).
- It’s involved in learning and memory.
- It can affect our perception of pain.
- It’s involved in behavior (such as aggression or addictions).
- It’s involved in many mood disorders (such as anxiety or depression), personality disorders (such as schizophrenia or bipolar disorder), and neurodegenerative diseases (such as Alzheimer’s).
- It helps regulate metabolism, body weight, and energy balance (food energy in versus metabolic or movement energy out).
- It seems to play a role in eating behavior and activity, including excessive activity or disordered eating.
Since BDNF is involved in so many metabolic, energy-regulating, eating, and activity behaviors, variations in the BDNF gene can be related to both lower and higher body mass. BDNF protein levels are often low in people who are obese or have Type 2 diabetes.
Conversely, exercise can increase BDNF levels, suggesting that even if we have a particular genetic variant of the BDNF gene, we can change how much BDNF protein we actually have circulating.
BDNF expression can also be affected by other epigenetic factors from the environment, such as:
- recreational drug use;
- early life stress; and
- intellectual stimulation and learning.
One particular BDNF allele known as Val66Met (SNP: rs6265) is so named because the nucleotides adenine and guanine vary, which results in a variation between valine and methionine at codon 66.
Some research has found that people with the methionine-methionine combination (aka met66) tended to be thinner than those with other combinations (i.e. valine-methionine or valine-valine).
Other research in participants of European descent has found that people with the met66 variant of BDNF were more likely to have various types of disordered eating behaviors, such as restricting food, binge eating, or purging.
These variants of BDNF didn’t just affect eating behavior; they were also involved in other behaviors like avoiding harm or taking risks.
Other genetic contributors
Researchers estimate that about 40-60% of our risk for disordered eating behaviors may be inherited.
By the way, remember our FTO gene from above, particularly the rs9939609 SNP? Of course you do! Well, it too may be involved in disordered eating, including restricting-type behaviors.
This tells us that FTO’s role is more complicated than simply being a “fat gene”.
Other sets of genes that may be involved in disordered eating behaviors include:
- genes such as MAOA (monoamine oxidase A), NET (NE transporter), and/or SERT (serotonin transporter) related to synthesizing and transporting feel-good neurotransmitters like oxytocin and serotonin;
- genes such as CNR1 (endocannabinoid CB1 receptor) and FAAH (fatty acid amide hydrolase) related to endocannabinoid pathways. These are involved in various processes such as our stress response, maintaining homeostasis, perceiving or dulling pain, and regulating food motivation and appetite (which is why using cannabis often gives you “the munchies” and is used for medical patients who have lost their appetite);
- genes involved in monitoring energy balance, such as LEP, which codes for leptin, a hormone that senses how much stored fat we have;
- genes related to appetite peptides such as GHRL, which codes for ghrelin, a potent stimulator of hunger; and
- genes such as DRD2, which codes for dopamine, related to the neurobiological reward and decision-making pathways (which are also involved in addictions).
What we found in our sample
We asked our test population whether they’d consistently or often done any of the following disordered eating-type behaviors:
- Going on a strict diet or cutting back a lot on their eating;
- Over-eating well past the point of satiety;
- Eating foods they craved, even though they weren’t hungry;
- Compensated for their eating (for instance, by restricting their food the next day, or by exercising a lot);
- Worked out a lot (more than 7 hours a week of purposeful “exercise”);
- Purged (e.g. vomiting, used laxatives, etc.); or
- Thought a lot about restricting food, going on a diet, specific food choices, working out, etc.
Here’s what they said:

OK, so does that mean that three-quarters of our sample has the “genes for disordered eating” because they’ve gone on strict diets?
Or that over two-thirds have a genetic inability to manage their appetite because they over-ate, or ate foods they craved when they weren’t hungry?
Or does that mean that this is common behavior in 2017? Especially for health-conscious, fitness-oriented people?
Our guess is that it probably means that “average” or “normal” genes (in other words, a genetic makeup without any unusually strong predisposition to do these things) can interact with our 21st-century environment that is:
- stressful and anxiety-provoking;
- focused on “healthiness”, fitness, nutrition and food fads;
- focused on bodies and “body discipline”;
- increasingly preoccupied with social comparison while also being socially isolating; and
- full of tasty, easily accessible, “crave-able” foods that are hard to stop eating.
What this means for you
- Genes affect our body shape, size, and leanness or fatness. You are at least slightly predisposed to have a certain physical makeup. However, you are not destined to have a certain physical makeup.
- Genes also affect the processes that happen when our body shape is smaller or bigger, leaner or fatter. For instance, if we gain or lose body fat, we can up- or down-regulate genes involved in processes like inflammation or blood sugar regulation.
- Human body shape and size is normally variable and diverse. There are many ways to have a “healthy”, fit, and functional body. Bodies come in all shapes and sizes. Some of that is inherited and some it is acquired or influenced by our environment. Even if you have many genetic variations that might predispose you to be a certain body shape or size, you are probably well within the range of “average” in most ways. Few genetic disorders are so extreme that they put you outside of normal human variation.
- Your body size and shape does not necessarily tell us everything about your genes or your behavior. For instance, we don’t know for sure that:
- a person with a specific body type is necessarily more or less likely to have problems with their metabolism, or how they eat.
- a person with a lower body weight is purposely eating less. They may also be genetically more likely to burn off excess energy as heat, for example, or have a stronger “stop eating” signal.
- a person with a higher body weight is purposely eating more. They may also be genetically inclined to store nutrients as fat, or have a stronger appetite and reward system.
- Energy balance, metabolism, and eating behaviors are all complex phenomena. A change in one can affect the others.
- Our environment matters. Consider what is around you: the cues, foods available, social norms, stressors, and so forth.
- Many factors that affect body weight and fat are within our control. Despite our natural inclinations and makeup, we can choose to eat less or more, to be more or less active, to eat particular foods, and so on. We’ll look specifically at what you can do in Chapter 12.
What’s up next
In the next chapter, we’ll continue with the theme of food to look at food preferences, and how these may be affected by our genetic makeup.

